

Europe's online source of news, data & analysis for professionals involved in packaged media and new delivery technologies


ANALYSIS: TV and physical media still drive entertainment spending
But online and mobile delivery of video, music and games is increasing. Consumers spend more on Pay TV services than any other entertainment sector, according to IHS Screen Digest. TONY GUNNARSSON and HELEN DAVIS JAYALATH, co-authors of this analysis, note that, while physical video market still dominates other forms of entertainment spending, consumption of media online or via mobile phones is expanding rapidly.
Consumer spending on total entertainment in the Western World – defined as North America and Europe – has grown by 62% since 2000. This includes spending on cable & satellite TV, home video, video games, music and cinema tickets. Ten years ago Western World spending totaled $145.1bn; last year it was $235.3bn. An analysis of the shifts in consumption over the past decade shows some clear trends. The largest sector of entertainment continues to be cable and satellite TV, which already dominated a decade ago when it contributed 39% of spending. The sector has expanded rapidly – increasing by 147% since 2000 – and now generates nearly two-thirds of total spending (59%).
Ten years ago, consumers worldwide spent fractionally more on music than on video across all platforms and formats (21% compared with 20%), but in the past decade the music industry has been decimated by its failure to capitalise on the shift away from physical formats to digital delivery. Over the period under analysis, Western World spending on music across all formats declined by 55%. As a result, today music accounts for just 6% of total entertainment spending according to our analysis. Over the same period, the increasing popularity of DVD stimulated several years of strong growth in total video spending but this peaked in 2004 at $40.7bn, and despite subsequent growth in video delivered on new platforms (online and mobile) overall video spending has declined every year since then.
Nonetheless, its 2010 total of $32.3bn was up still up 14% on the 2000 figure and video remains the second largest area of entertainment spending after TV. However the continuing expansion of cable and satellite meant that video's share of total spending was only 14% last year compared with 20% in 2000.
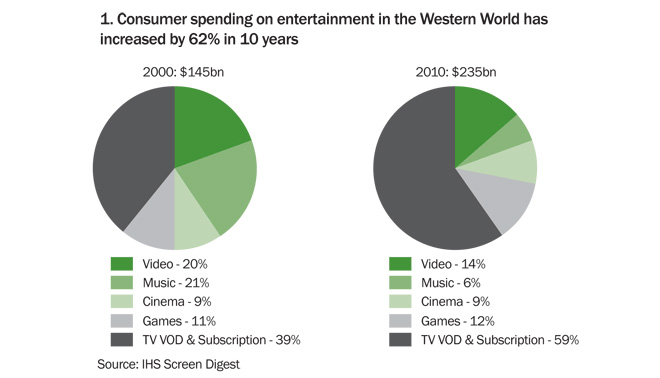
The balance between games and cinema, the next largest sectors, has also shifted. In 2000, consumers spent more on buying video games than buying cinema tickets (11% vs. 9% of Western World total). But while both sectors have seen strong growth in the last decade, driven by the expansion of gaming into new demographics and the digital 3D boom respectively, spending on games has increased substantially faster than that on cinema: 86% vs. 49%. Last year games generated 12% of total spending compared to cinema's 9%.
If spending on cinema tickets and cable and satellite subscriptions are excluded from the analysis, the shift from physical to digital and mobile delivery mechanisms becomes more visible. Having peaked at $83bn in 2008, total spending on 'entertainment media'-video, music and games content consumed via either packaged, digital or mobile platforms-was only marginally higher in 2010 than in 2000, at $74.8bn.
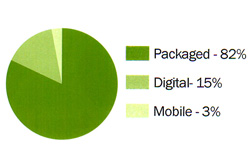
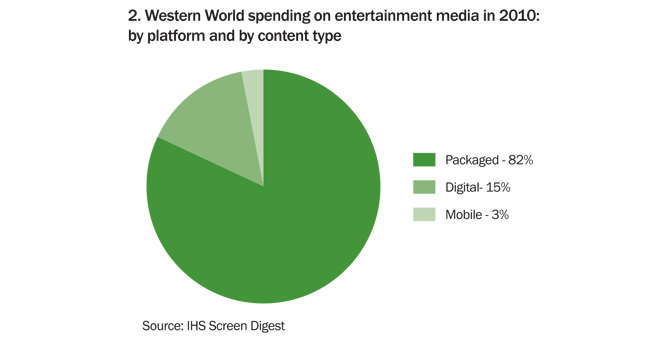
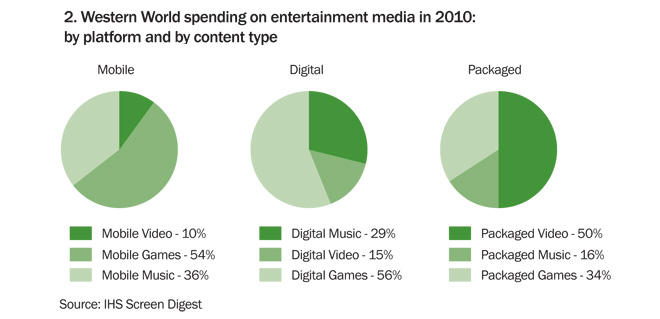
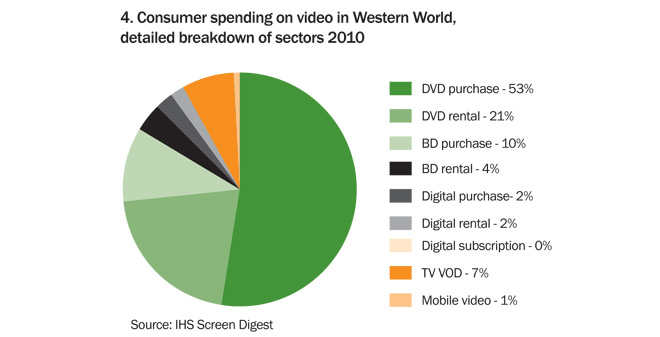
Packaged media still accounts for the lion's share of spending in this sector – 82% – with the purchase and rental of DVDs and Blu-ray Discs generating half this figure. Thus physical video remains the largest driver of global spending on entertainment media overall (40%). Video games account for a third of packaged media spending (34%), while physical music account for 16%.
Consumer spending on content via digital platforms generated 15% of entertainment media in 2010. Digital spending is dominated by online gaming, which accounted for over half of all spending on digital media (56%). Music, accounting for 17.4% of total entertainment media, is the second largest area of digital spending, where it generates 29%. Video accounts for 15% of spending on media consumed via digital platforms, or just 2.2% of total global entertainment spending. Games also dominate the mobile media sector (54% of spending), followed by music at 36% and mobile video at 10%. However, mobile media as a whole only generate 3.4% of spending.
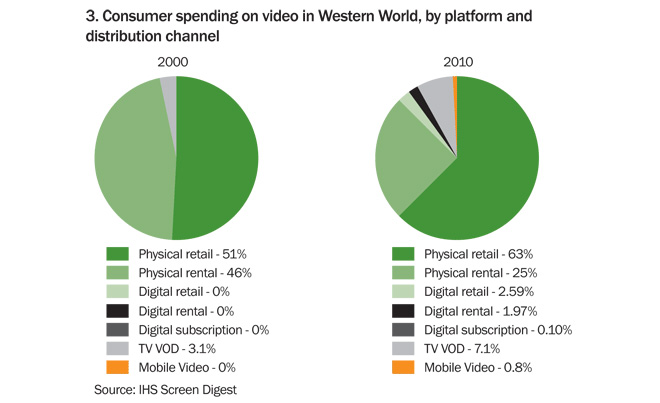
Meanwhile the last decade has accelerated the shift away from rental as a means of consuming video. In 2000, consumers spent almost as much renting VHS and DVDs as they did buying video (rental generated 46% of spending, while retail generated 51%). It was still early days for TV VOD in 2000 but movies and TV shows purchased on a transactional basis through TV sets (arguably a form of rental) already made up three per cent of spending in 2000.
Last year physical purchases generated 63% of total spending compared to video rental at only 25%. But only some of this 'lost' rental business has transferred to TV VOD, which still only generates seven per cent of all media spending. Video consumed through digital platforms generated 4% of entertainment media last year, with two-thirds being purchases as opposed to rentals. Meanwhile, movie trailers, TV shows and short-form video clips delivered to mobile platforms (a predominately purchase-based rather than rental business model) accounted for just one per cent of entertainment media.
Not all markets reflect the Western World trends, of course. In terms of packaged media, North Americans spend more on buying and renting video – 56% compared to 43% in Europe. Consumers in North America rent more video than any other international market. Ten years ago, video rental generated 53% of North American media spending, but by 2010 physical rental's share had fallen to 34%. But the decline in video rental has been much faster in Europe – down from 32% 10 years ago to just 11%.
North America is also ahead of the combined European market when it comes to the development of digital media. Digital media generated 17% of North American spending in 2010, compared with 12% in Europe. However, while packaged music now accounts for just 9% of total spending in North America, it has double that share across Europe. This reflects the fact that North American consumers buy more digital music than their international counterparts, with this sector generating 6% of American spending but just 3% in Europe, indicating that the shift from physical to digital music has so far been faster in North America.
The same is also true for music consumed via mobile devices, with 2% of North American spending on entertainment media now being generated by mobile music compared with just 0.6% in Europe. This is despite the fact that North America is only just ahead of Europe when it comes to overall spending on mobile media – 4% of total entertainment media spending, compared to 3%. Overall, however, music's share of entertainment spending remains higher in Europe than in North America (15 v. 5%).
Beyond the Western World, consumption of media in Asia Pacific reveals an even faster shift away from packaged media. In most of the rest of Asia high levels of piracy affect sales of physical content [explain impact]. Finally, our research shows that there is virtually no physical games market in Asia Pacific outside Australia, New Zealand and Japan - instead online gaming has become hugely popular in markets such as China, Korea and Japan.
Unlike in the mature markets of North America and Europe, the shift to digital is happening in Asia Pacific while many of these markets are still developing – since 2000 the overall Asia Pacific entertainment market (packaged, digital and mobile media, cinema and TV) has nearly doubled in value from $41bn in 2000 to $81bn in 2010. This is even without the inclusion of the massive online gaming markets of Korea, Japan and China, data for which is still being collated by IHS Screen Digest, but which we estimate is already worth more than the total worldwide market for buying and renting SD ($5.9bn). Most of this growth is generated by Pay TV, spending on which has more than quadrupled over the decade (from $11bn to $45bn).
Meanwhile packaged media spending peaked much earlier in Asia Pacific than in the Western World, in 2002, and by 2010 spending on this sector had fallen from $28.6bn to $18.7bn. In terms of packaged video, the cultural preference in the key Japanese market (the world's second largest rental market after the US) for renting rather than buying physical video means that the regional split between retail and rental is more balanced than in the Western World (53 v. 47 per cent).
Spending on mobile media is much higher in Asia Pacific than in the Western World - $8.1bn compared with $2.5bn. The biggest contributor to mobile music spending globally is the vast Chinese market, where budget-priced mobile music subscriptions have proved massively popular. Our research shows that Chinese consumers spent $5.3bn on buying music over mobile platforms last year.
Story filed 17.03.11
More Articles...